Written by Becky Fitzpatrick, Digital Marketing Associate
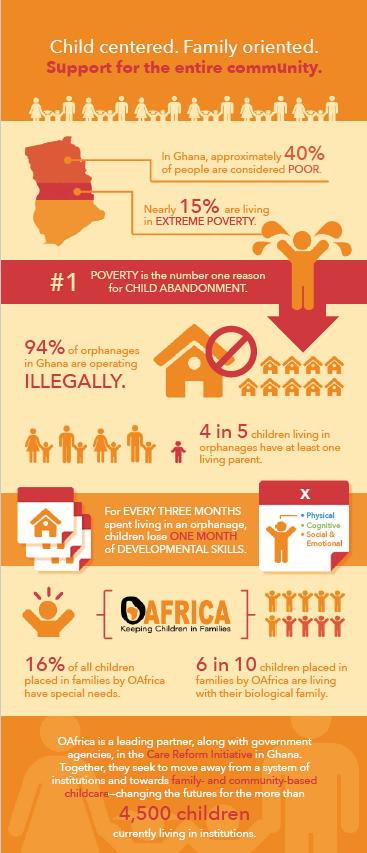
Infographics are a popular way for organizations to show data in a visual and engaging way. With short copy, easy to read statistics and engaging graphics, infographics are wildly popular on social media.
Nonprofits can use infographics in multiple avenues for fundraising and marketing. They can be added as inserts in direct mail pieces, act as the copy of an e-appeal, stand out on a landing page, or go viral on social media.
Here are four tips our design team uses when creating an infographic for our nonprofit clients:
1. Use relevant and updated data – make sure all sources are accurate, data is from recent studies, and all sources are properly cited
2. Tell a story – data and numbers can be compelling on their own, but only if they form a complete story. Let the numbers lead to a conclusion or call-to-action!
3. Keep it simple – infographics are there to make reading data easier. Keeping the design simple, the font easy to read, and the graphics easy to comprehend will make your infographic successful.
 4. Make it visual – few people enjoy looking at charts and graphics, but if you use an appropriate color pallet and pair statistical graphics with photos or graphic elements, they become compelling and exciting.


